We received the following question from an Intervals customer:
Is there a report I can run that shows how many tasks we are closing per week? Ideally by person or by project.
Some of our customers user Intervals as a ticketing system. With this use case there is often a need to not only report on time (typically by task/ticket) but also show velocity. They want to be able to show their customers how many tasks they are closing out by date range. If you have a similar need, the Task Snapshot Report can be used for this.
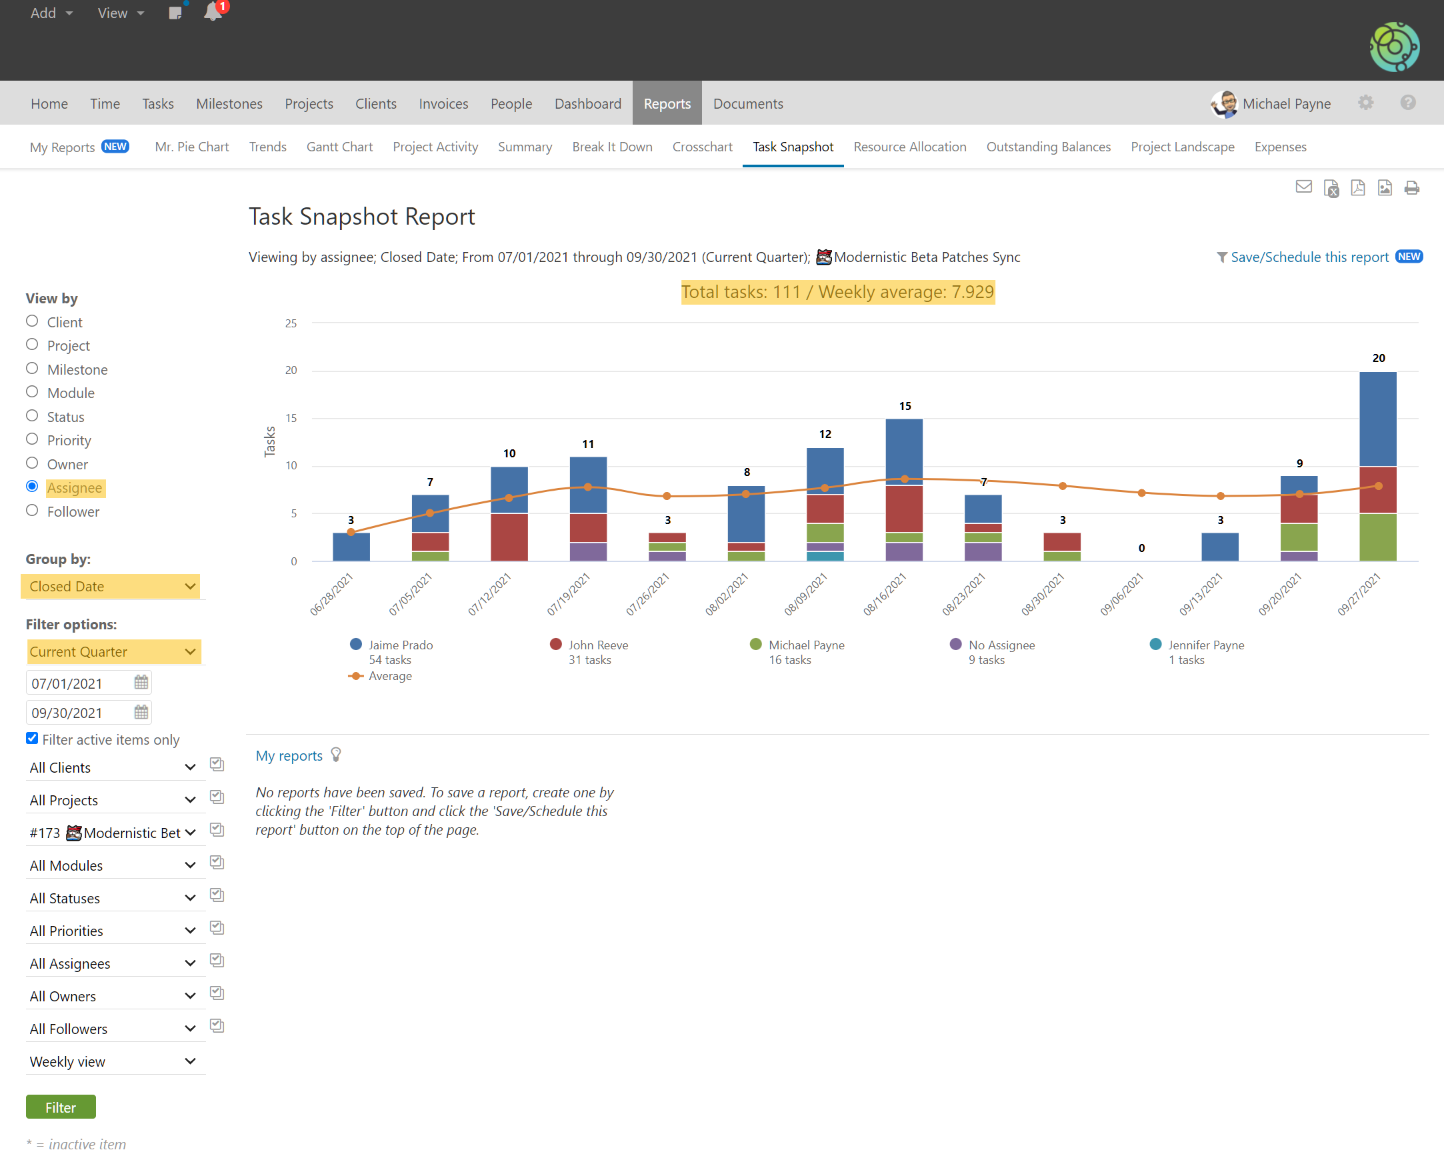
Here is an example of how the report looks:
In this example the report is showing how many tasks are closed by week for the current quarter for a given milestone. It also shows who the tasks are assigned to. There are various grouping options and the report can be run for a single assignee across clients and projects or for all projects and all assignees for a given client. Like many of our reports there are many different filter and grouping options depending on your needs.
Once you find the filtration that works best for your needs, if you need to re-generate the report at a regular interval we recommend saving and scheduling the report for delivery.
