The Mr. Pie Chart Report allows you to slice and dice the data in many different ways. It is a great tool for high level data segmentation. First, start by selecting a “View by” option.
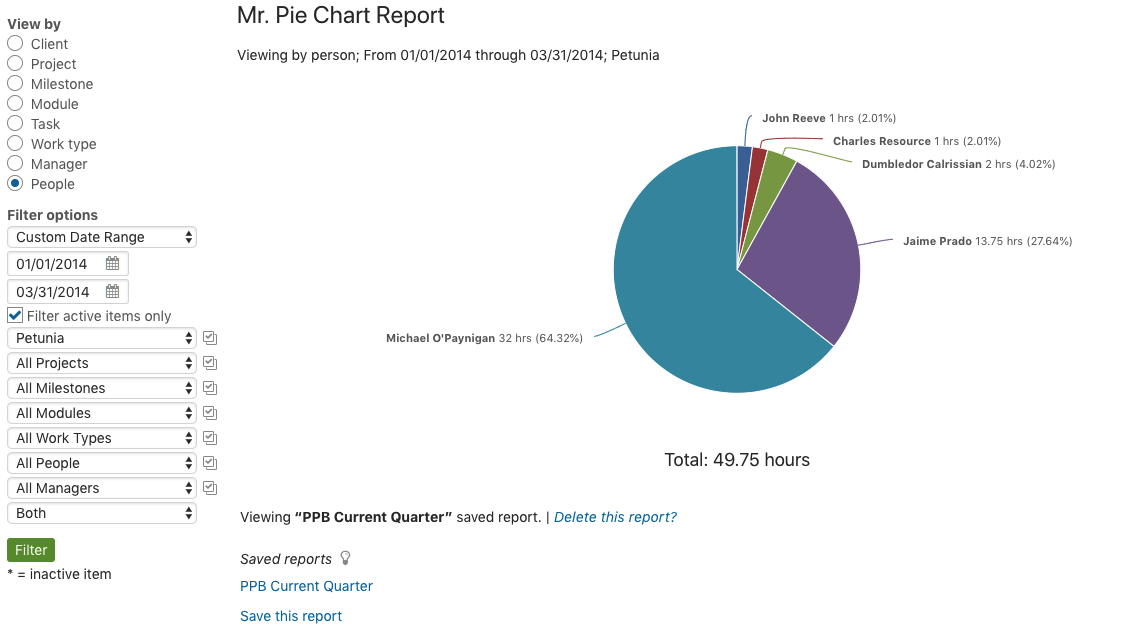
In this case, the report is run by person and Current Quarter from the Custom Date Range drop down.
Like all other reports, this report has options to filter by client, project, milestones etc.
When you run the report, there is also an option at the bottom to save it. When you do this, the report translates the custom date range into today’s date as a reference. This way, every time the saved report is loaded, it will use today’s date relative to the date range you select from the custom drop down. In the example above, the current quarter will always load.
Popular Mr. Pie Chart reports:
- By project
- By work type
- By category
- By client