The Crosschart report enables you to customize the x and y axis and it is a good report to retrieve hi-level information. The default is person for the x-axis and project for the y-axis but the combinations that can be generated are plenty. If you are a fan of cross tabbing, this report is for you. We use this report in our weekly goals meeting and look at hours by person and project for the previous week. We use the report to get a feel for if our hourly efforts match our priorities.
Popular filters:
- x-axis person / y-axis project (current month)
- x-axis person / y-axis work type YTD
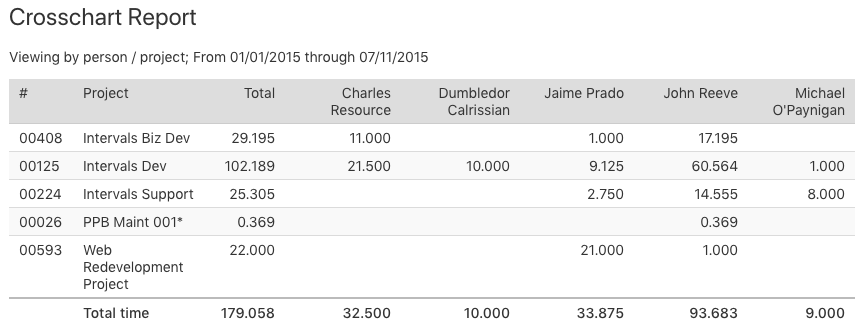
Here is a basic example of what the report looks like.