We received the following support question:
Can I see how much total billable work has been done by month or quarter? I don't need details just totals. I want to analyze my team and clients. Most of the reports show detailed work.
The Break It Down report is one of our reports that helps you quickly analyze your billable versus unbillable mix of hours. The report was created from feature requests from customers, mainly consultants and agencies that use Intervals for their billable client work and internal non-billable work. It can be used to see how many billable and unbillable hours have been tracked in a variety of ways (by client, by person, by task, etc.). You can even run it by person and task if you like. The report is very flexible and customizable and can be saved and scheduled for delivery.
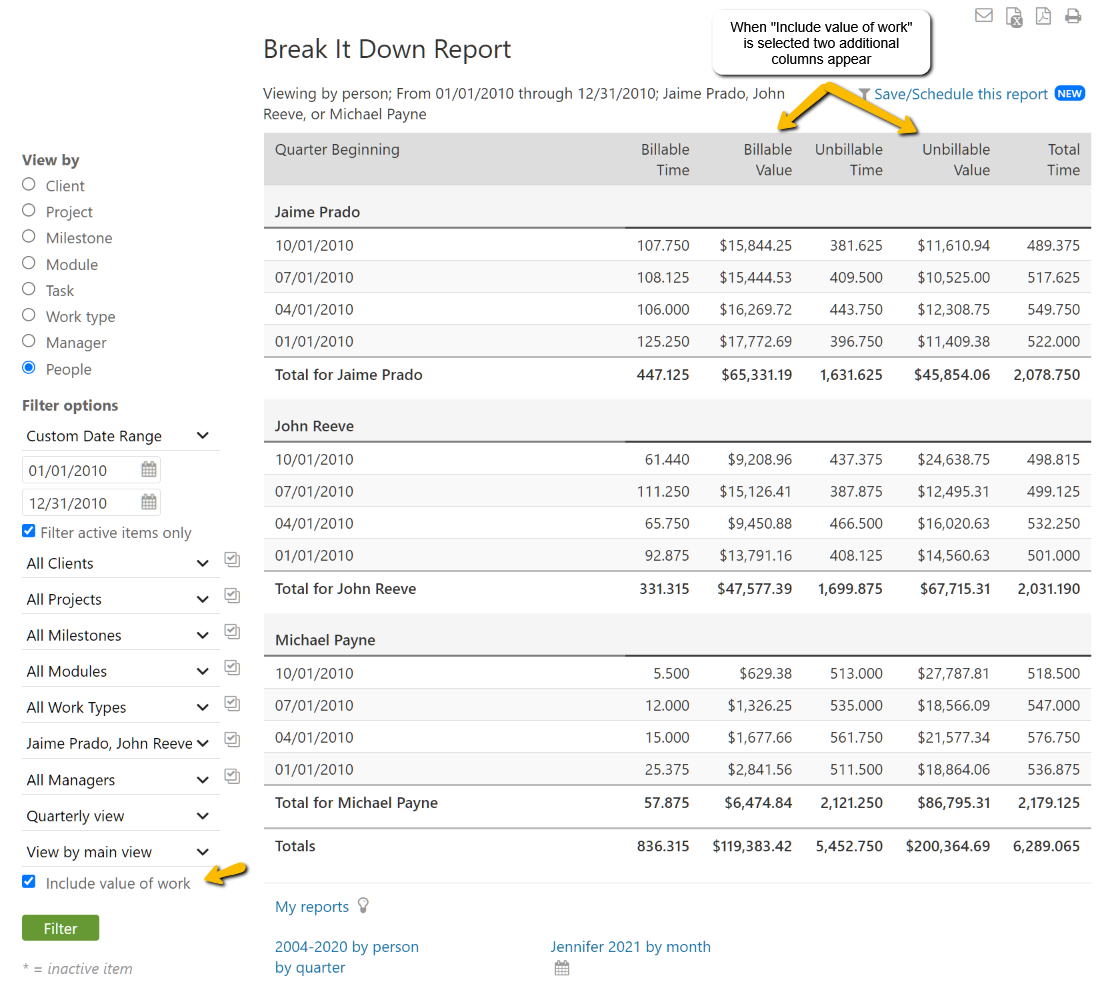
We are pleased to announce the report has been upgraded and includes an option to show the financial value of work in addition to the hours. When running the report there is an option to “Include value of work” above the filter button. When selected, two additional columns are added that show the total financial value of billable and unbillable work.
Here are some common uses for this report.
- Review monthly billing for recurring client work.
- Determine which client (or project) had the most billable work by month
- Analyze your team to see who has the most (or least) billable hours
- Analyze which work types are generating the most billable work
- Determine which managers are leading the most billable and unbillable projects