The visual dashboard is similar to a report. But, instead of simply churning out numbers, the visual project dashboard gives organization and structure to your project data, and answers two important questions…
How healthy are my projects?
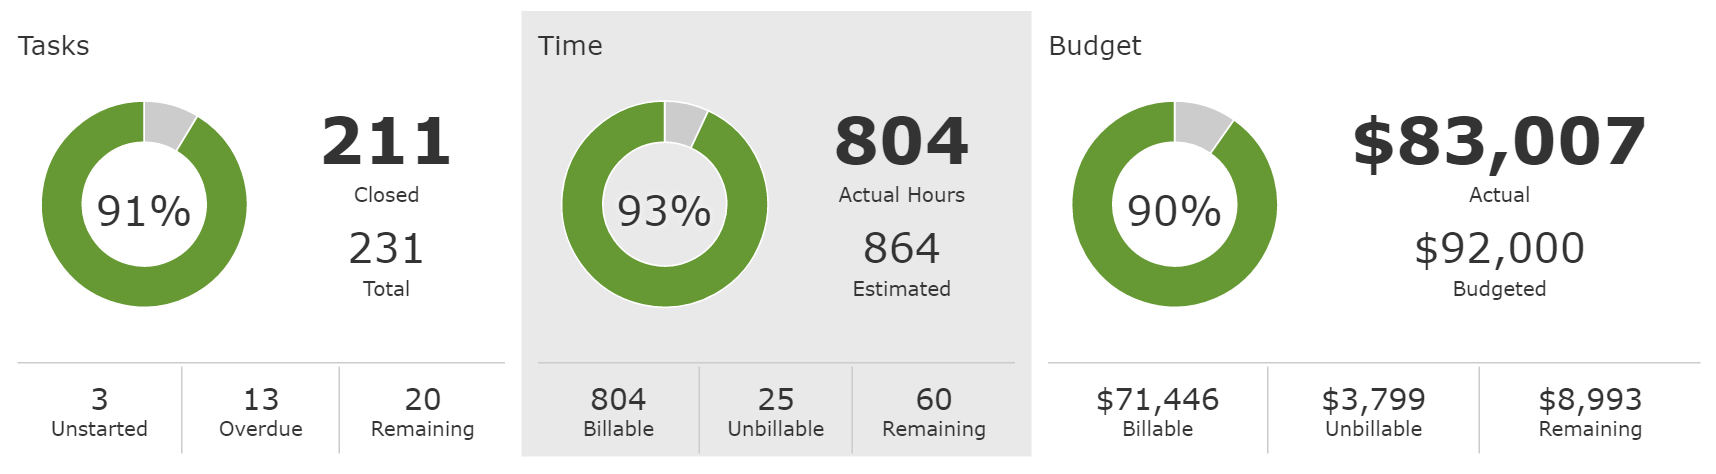
The top half of the visual dashboard consolidates all of the project data returned by the filters and organizes the data into three sections — tasks, time, and budget. The pie charts show the percentage of work completed in each section. There are a few additional additional snippets of data below each graph, for example, the number of overdue tasks, and the number and value of unbillable hours.
Two suggested use cases to get started are as follows. Filter the dashboard by client to see the overall health of their current projects. Or, run it by project manager to see how well they are managing their current project load.
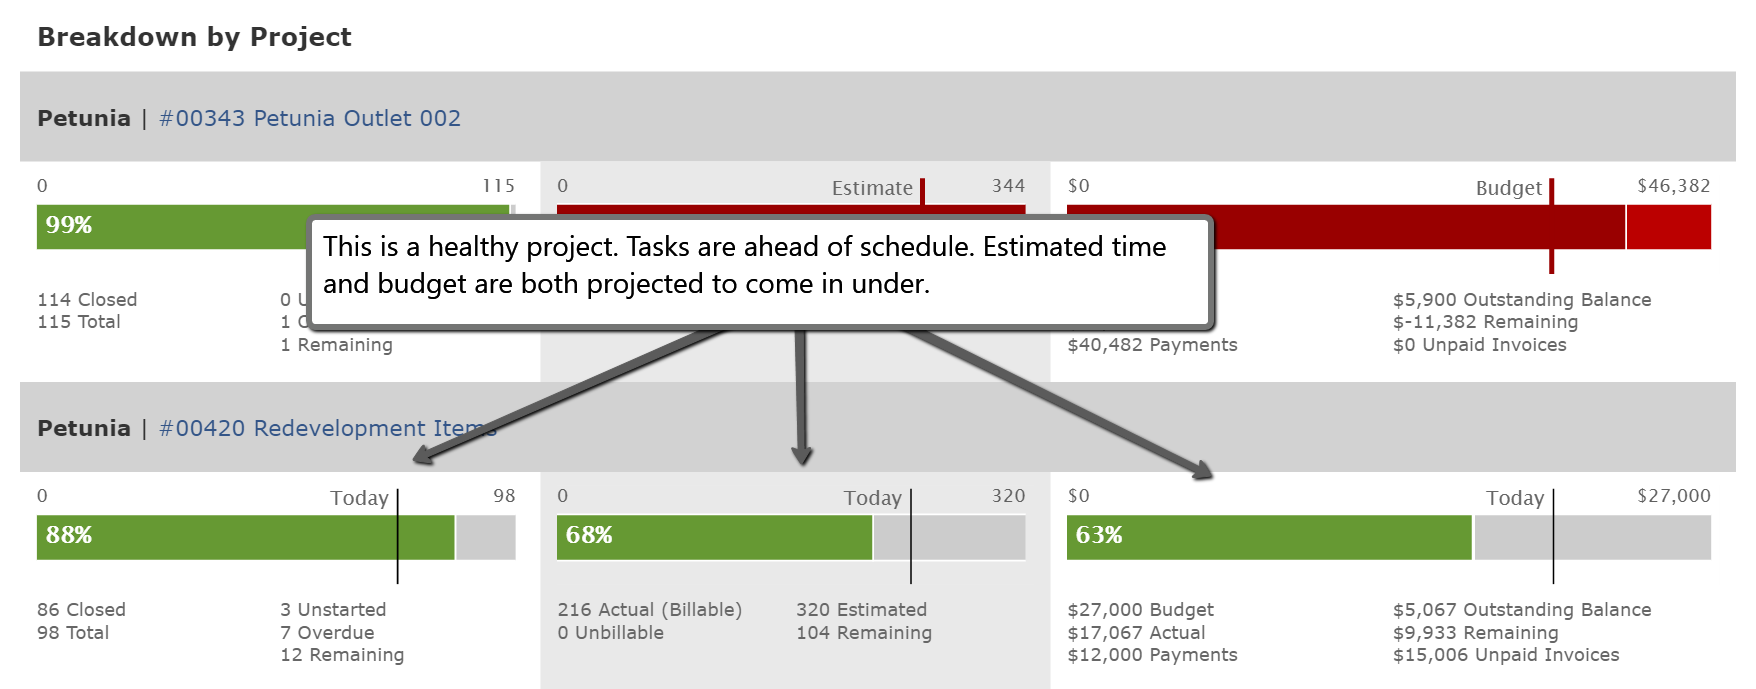
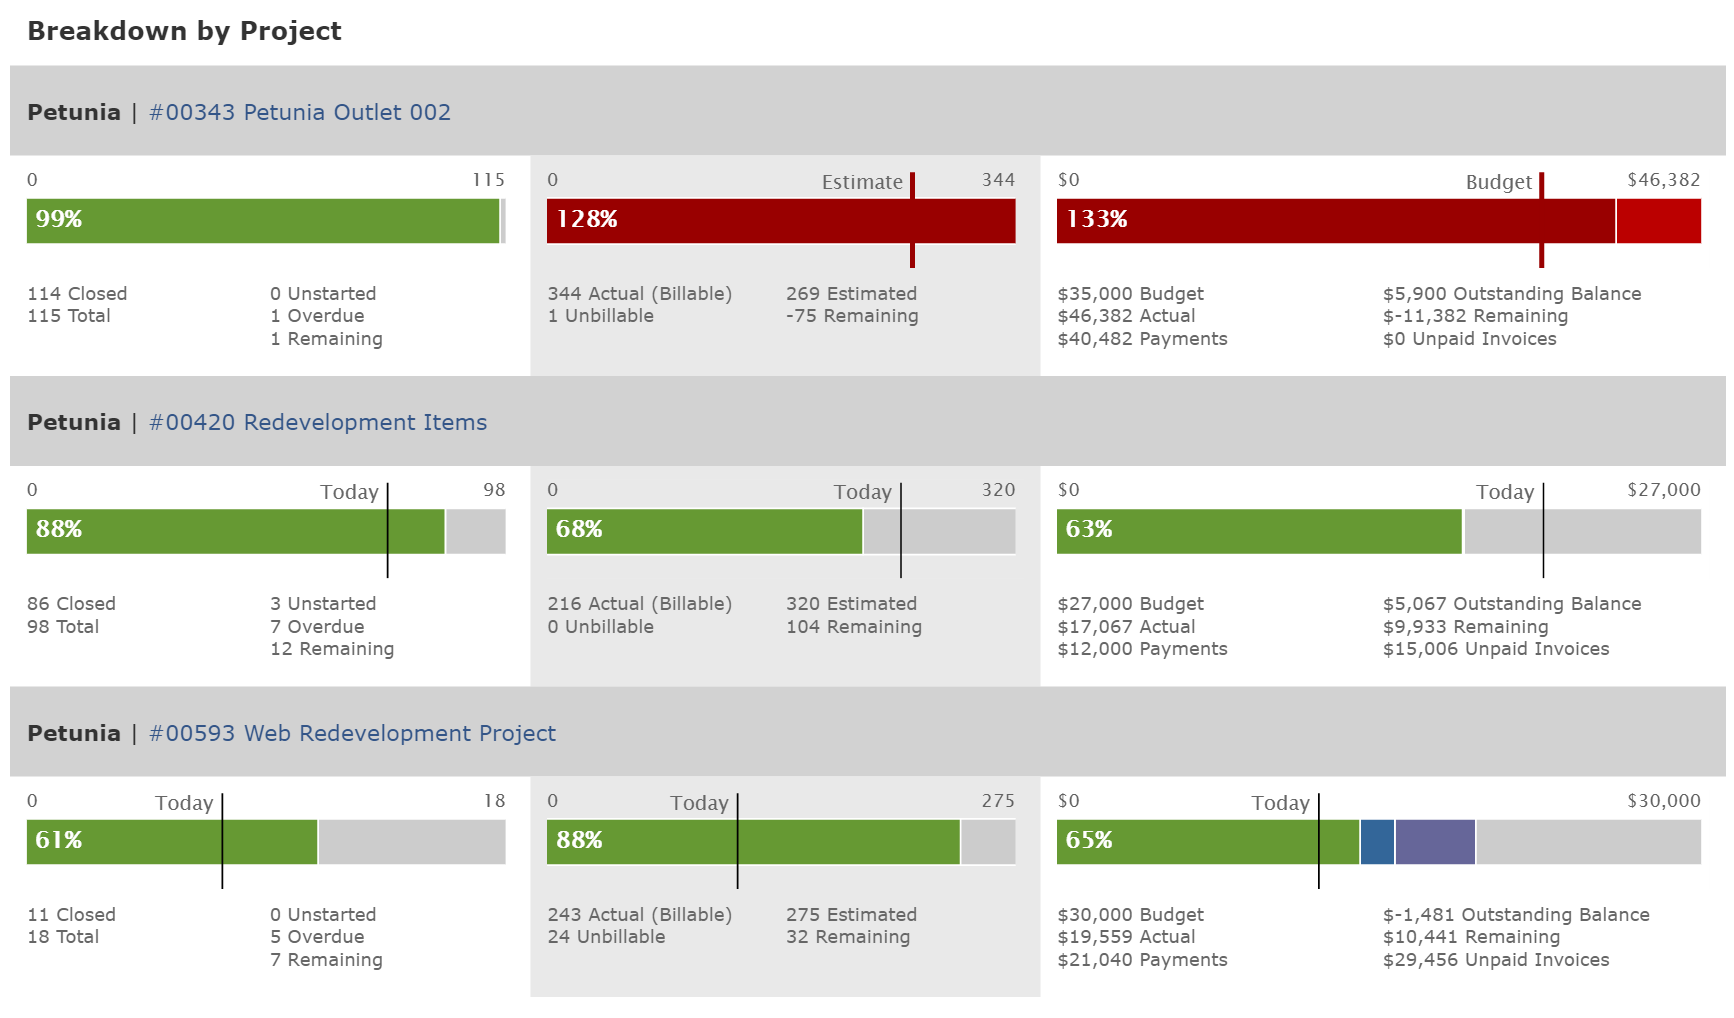
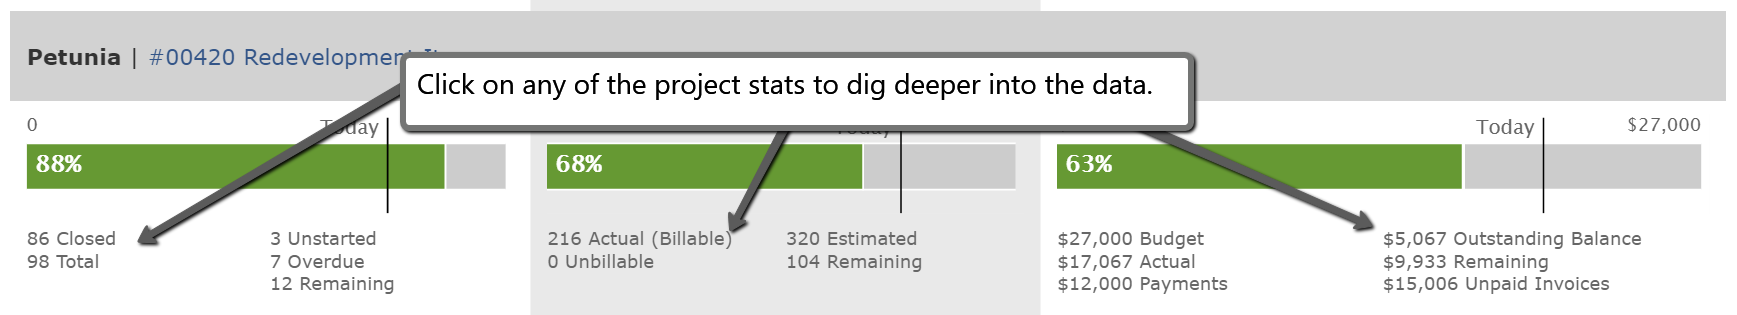
Scroll down to the lower portion of the dashboard for visual reports on each project. Here you will find the percentage of tasks, time, and budget used. The dashboard will also show which projects have overdue tasks and unbillable time. This lower section enables you to quickly learn which projects are healthy, and which are not.
Graphs for current projects will display a vertical black line positioned relative to today. For example, if you are ten days in on a 20 day project, the vertical black line will appear at the halfway point. This indicator is designed to help with project pacing by visually alerting you to projects that might be trending toward going over budget or past their deadline.
What should we be working on next?
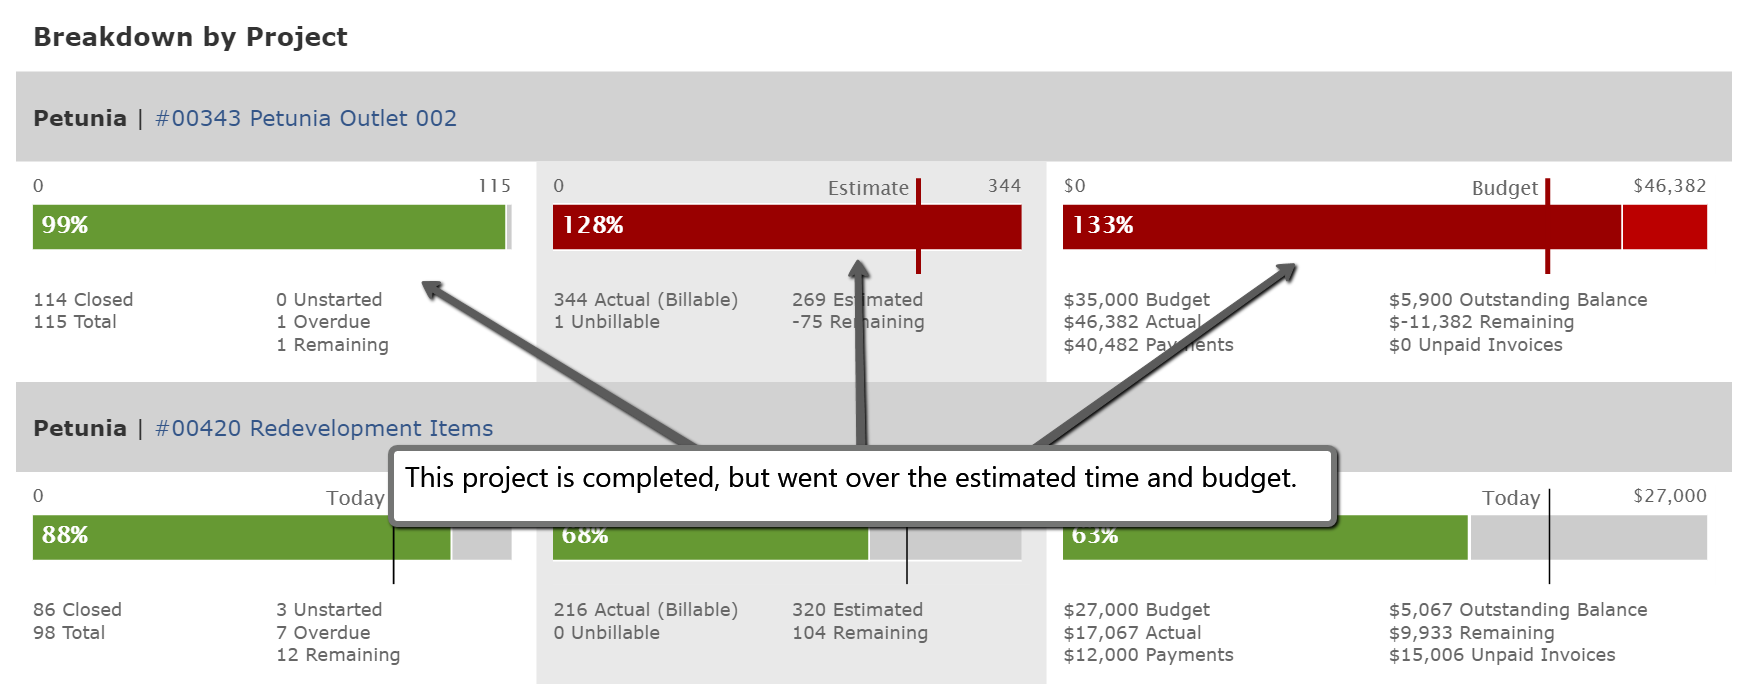
The lower portion of the dashboard breaks down the numbers for each project to help steer you in the right direction when trying to figure out what to work on next. For example, if a project has a lot of overdue tasks, it obviously requires immediate attention. Click on the number below the project graph and Intervals will pull up the listing of overdue tasks. Need to know which tasks haven’t started? Click that number to retrieve the list of unstarted tasks.
The stats that appear under the time and budget graphs are also helpful in steering a project in the right direction. If a project has only a few hours of estimated time left, click that stat to pull up a detailed report of estimated and actual time for the project to decide where to focus your remaining time.