The Project Dashboard is an overview that shows tasks and time. At the top there is a quick overview of the tasks by status and links to a report if you wish to see more detail. At the top right there is a time overview pie chart for a quick glance at the usage spread of the project hours:
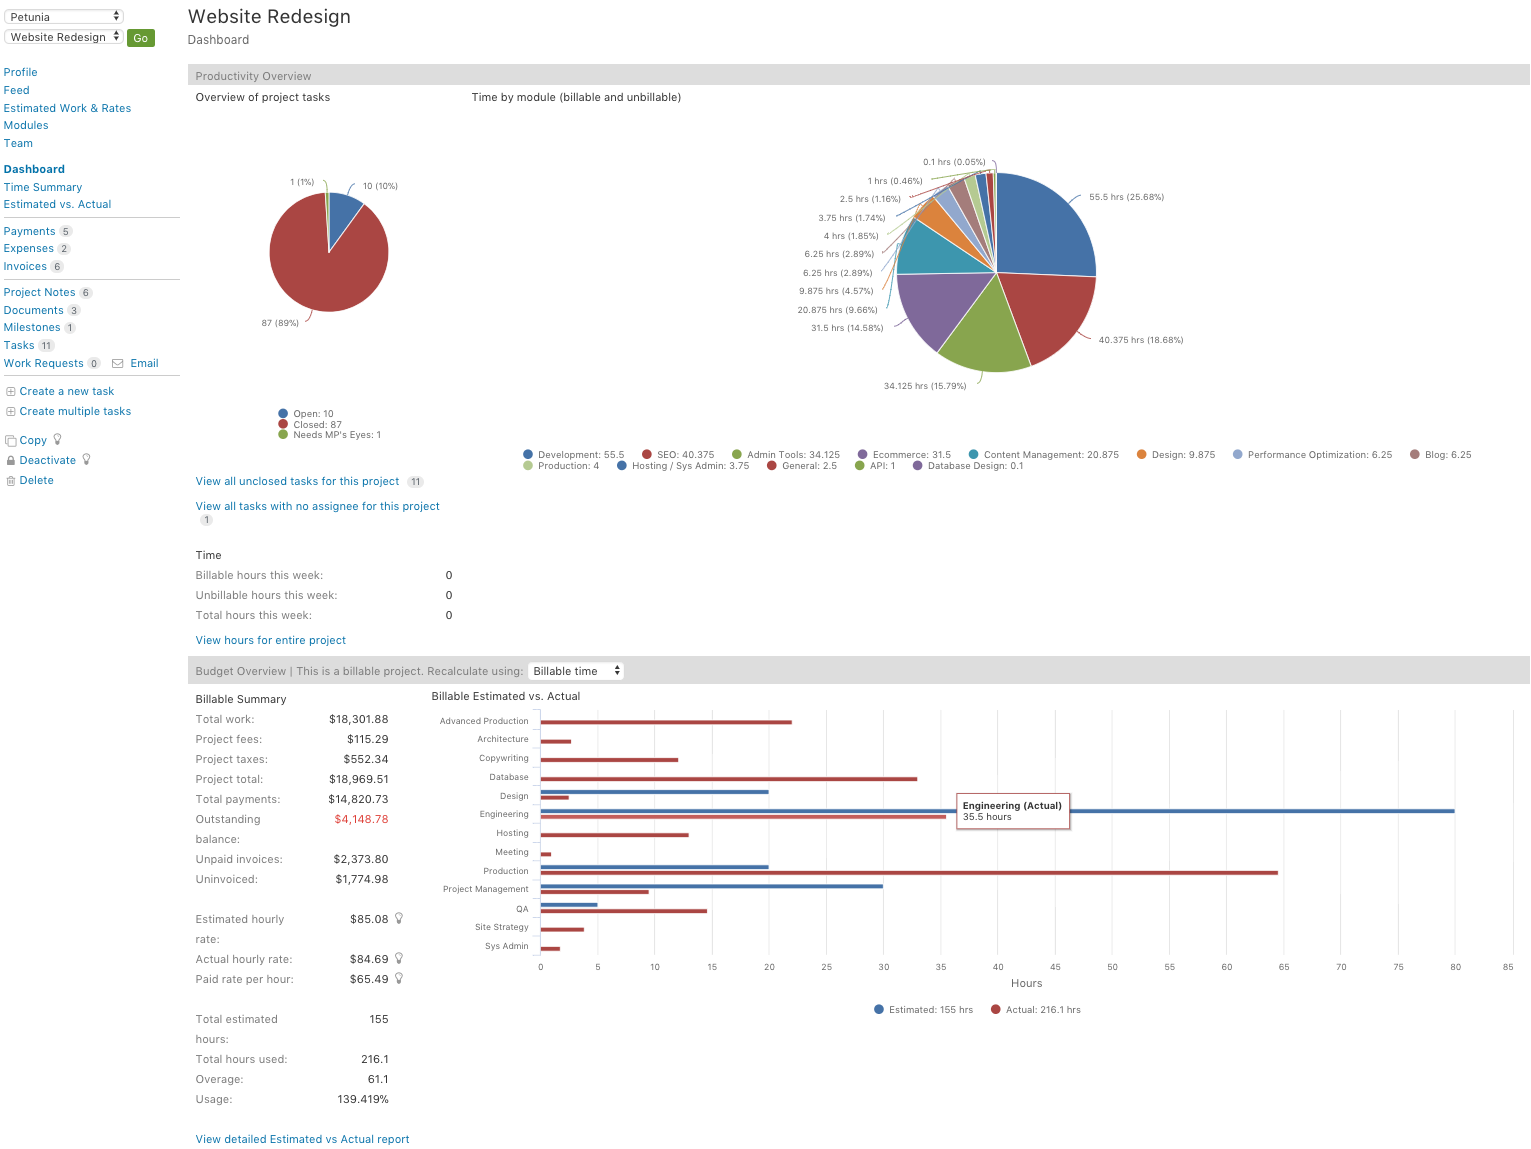
The bottom shows a financial summary. This gives you the latest dollar amounts for value of work, any payments, and if you have a project credit or overage. On the right you also have a quick graph depicting the latest spread of usage of time comparing estimated vs. actual.
In the last section, there are links to reports with the data for this project. Each report below will run for the life of the project. The ‘life of the project’ is determined by the first and last time entry for this project. The start and end date fields will be blank on the report page when you run the report, but you can narrow down the date range if you like.