Two minute Intruction to the Intervals Gantt chart
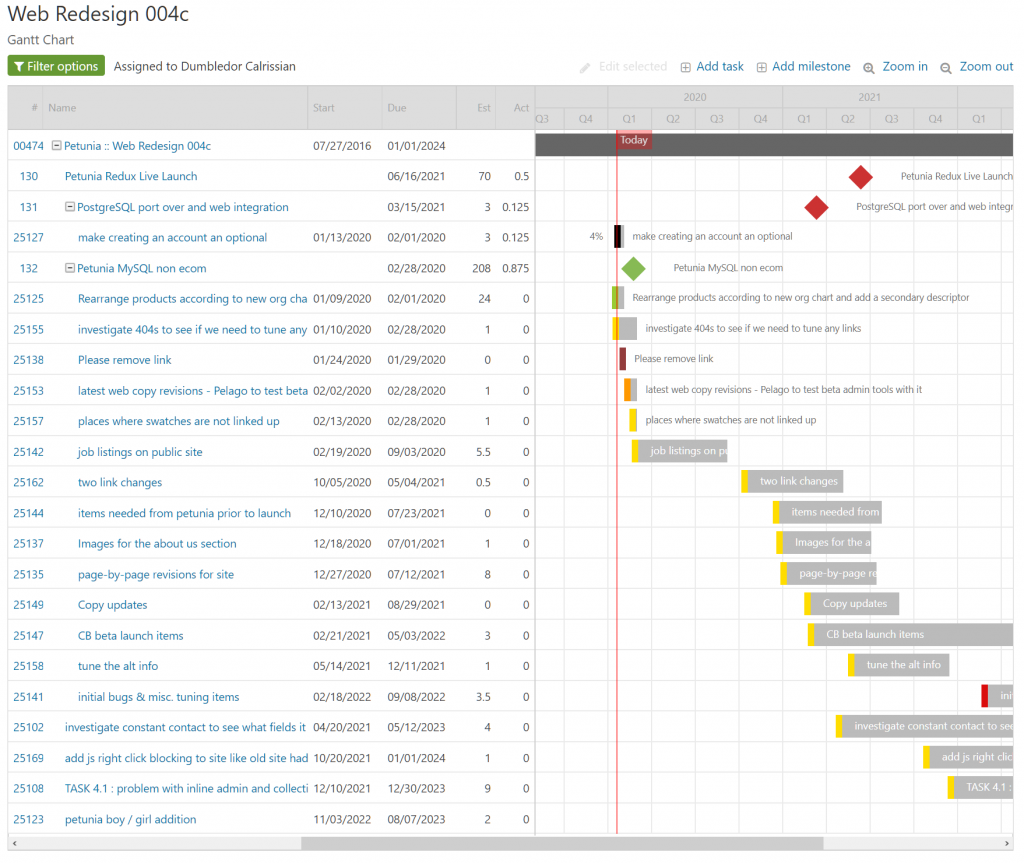
If you are new to Gantt Charts (checkout Wikipedia for a history of Gantt charts), a Gantt chart is a visual representation that shows how a project is meant to unfold. Many organizations use “project plan” and “Gantt chart” as synonyms. A Gantt chart is primarily a planning tool as opposed to a doing tool. A Gantt chart visually shows who is working on what and when and how a project is progressing. Gantt charts have traditionally been used with the waterfall model of project management, but they have found their way in a variety of methodologies, including Intervals. If you have a complex project and need to put a project plan in front of a client or review a deadline with a team, Gantt charts can be valuable visual communications tool.
Use Case
The most common uses for a Gantt chart include planning out a project to get to a reasonable deadline or creating a visual representation to communicate a project plan. This can be done to update a client on status or for getting client sign off on a project.
The second most common use case is to make a lot of project updates quickly. If you need to reschedule a project including its tasks and milestones, the Gantt chart is a great way to quickly move around a lot of work.
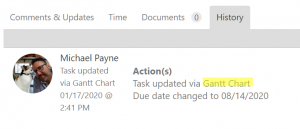
Unlike updating tasks on the home page calendar or the task listing, when updating tasks and milestones from the Gantt chart no notification emails are sent to your team. This is done by design due to the mode of working. Most of the time when interacting with a Gantt chart you are planning out a project and tuning the tasks to get the desired outcome OR you’re making a lot of updates to a project at once. Changes are logged on tasks and milestone as having occurred via the Gantt chart so that you can reference them, but no notification emails are sent.
If you have any questions about the Gantt chart please contact our support team.

