One of the core strengths of Intervals is its comprehensive and intuitive time tracking features. Whether or not you bill hourly for your time, tracking your working hours in Intervals results in a trove of useful data that can be analyzed using a suite of fast and flexible reports. In this help article, we’ll show you how the Project Activity and Break it Down reports, combined with Excel, can be used to get a detailed accounting of profitability.
Project Activity Report
Best for: Measuring profitability per hourly rate
The default view of the project activity report is a summary of your time grouped by hourly rate. This makes it the ideal candidate for measuring profitability by work type. For example, the report can tell us how many hours were spent performing various responsibilities, such as managing the project, attending meetings, writing documentation, and so on.
The first step is to run the report for the date range that you want to analyze. Use the filter options in the left column to refine the data by client, project, and other criteria if needed.
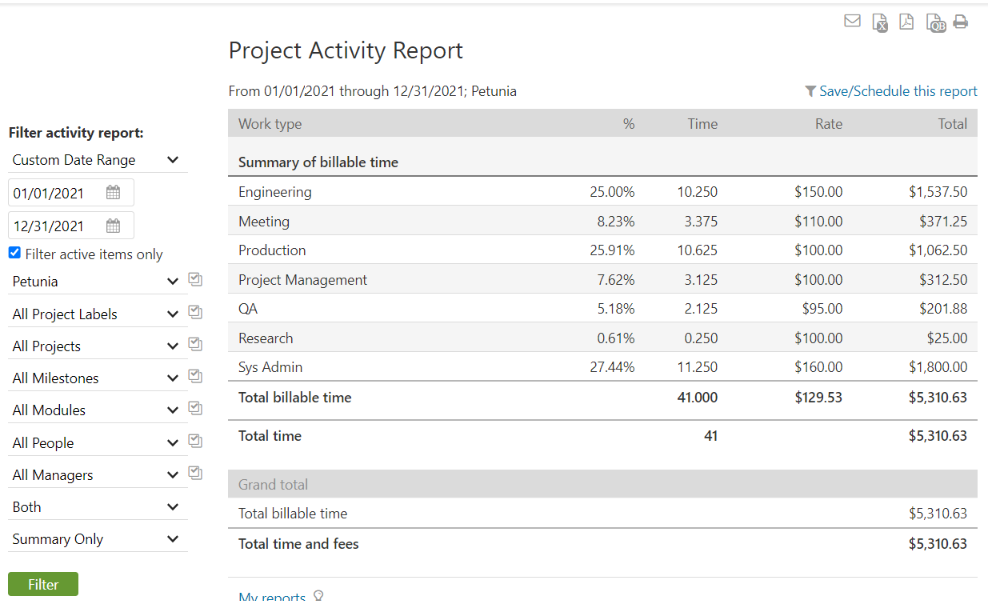
Once you have the correct view of your data, export the report to Excel by clicking on the icon in the upper right corner of the report.
![]()
Open the exported file in Excel and add two columns. One for hourly cost, and one for profit. Add the profit calculation to the first row of data, then expand that to all rows.
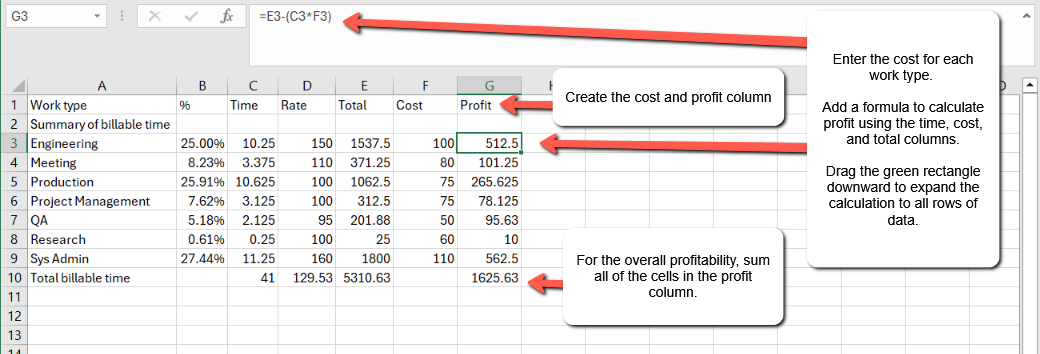
That’s it. Now you have a detailed analysis of how much profit each work type generated.
Break It Down Report
Best for: Measuring profitability per person
The Break It Down report provides a powerfully simple way to analyze time by day, week, or month over a given period. The data can also be segmented by person, which makes it ideal for measuring your team’s tracked time over sequential periods. For example, the report can show how many hours each person put in each month since January.
The first step is to run the report for the date range that you want to analyze. Select “People” as the “View by” option in the left column, and make sure the box labeled “Include value of work” is checked. Then, use the other filter options to refine the report more if needed.
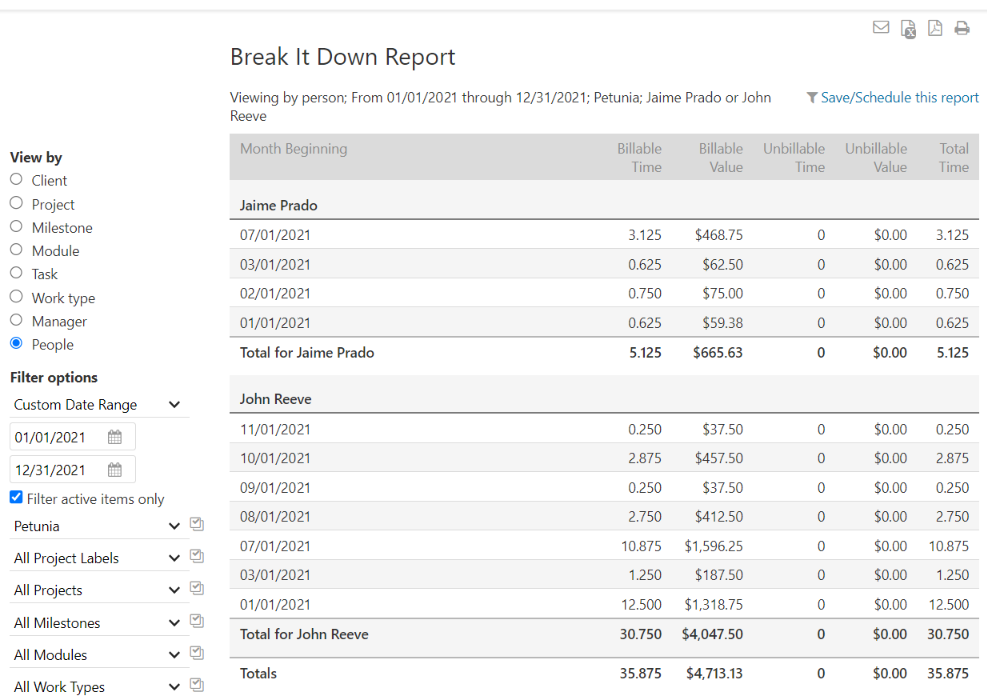
Once you have the correct view of your data, export the report to Excel by clicking on the icon in the upper right corner of the report.
![]()
Open the exported file in Excel and add two columns. One for hourly cost, and one for profit. Add the profit calculation to the first row of data, then expand that to all rows. The profit should be calculated by first multiplying the hourly cost and billable time, then subtracting that from the billable value.
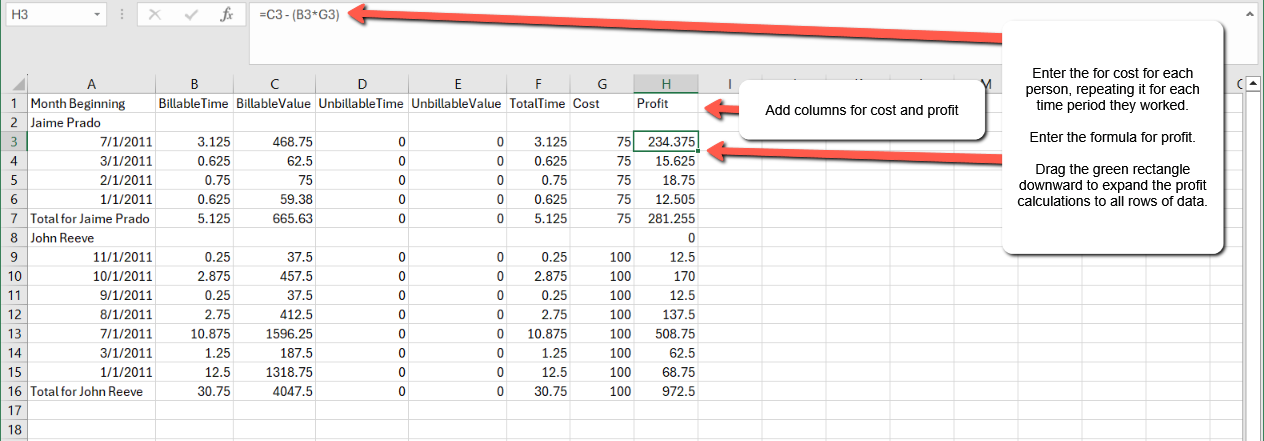
That’s it. Now you have a detailed analysis of how much profit each person generated.